  2 x 20 el. X-Yagi, RHCP (KLM 435-40CX, nominal gain 15.2 dBdC @ 436 MHz)
    Az/El controlled
  4-cavity filter 435-438 MHz, insertion loss @ 437 MHz approx. -1.9 dB
  Preamplifier: SP-7000 (nominal noise figure 0.9 dB, amplification 20 dB)
  Receiver: IC-970 with TCXO (CR-293) and 500 Hz CW-Filter (LF-132)
  Frequency calibration: 3rd overtone of IC-821 at 145.69792 MHz,
     checked with 225 MHz Frequency Counter (HP5382A)
  FFT-Software: Baudline
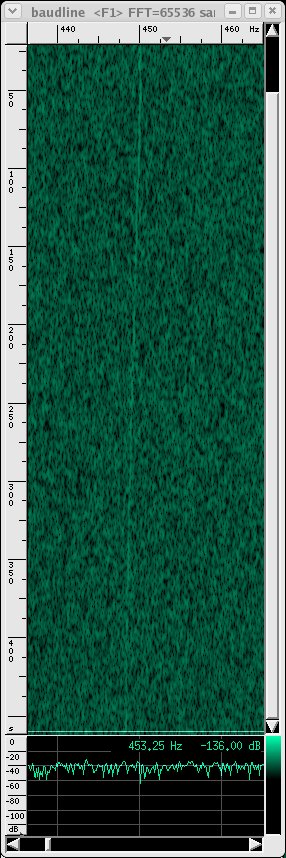
  Sep 22 05:54 mro1vkw.wav  3696044 bytes (462 sec)
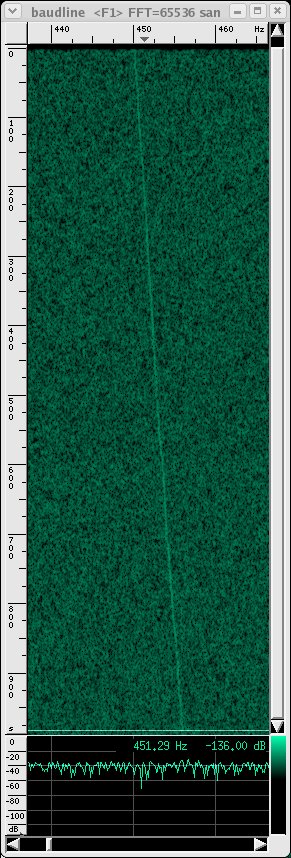
  Sep 22 07:32 mro2vkw.wav  7912044 bytes (989 sec)
The wav files can be accessed for further inspection: mro1vkw.wav mro2vkw.wav
 Date__(UT)__HR:MN     Azi_(a-appr)_Elev         delta    deldot  Rx frequency
**************************************************************** (437093+x)kHz
$$SOE
 2005-Sep-22 05:45 *m  289.9973  32.4927 1.4004676E+07   4.30381  0.7250
 2005-Sep-22 05:46 *m  290.1478  32.3356 1.4004934E+07   4.30402  0.7247
 2005-Sep-22 05:47 *m  290.2984  32.1787 1.4005192E+07   4.30423  0.7244
 2005-Sep-22 05:48 *m  290.4488  32.0220 1.4005451E+07   4.30444  0.7241
 2005-Sep-22 05:49 *m  290.5993  31.8654 1.4005709E+07   4.30464  0.7238
 2005-Sep-22 05:50 *m  290.7497  31.7089 1.4005967E+07   4.30483  0.7235
 2005-Sep-22 05:51 *m  290.9001  31.5526 1.4006226E+07   4.30502  0.7232
 2005-Sep-22 05:52 *m  291.0504  31.3965 1.4006484E+07   4.30521  0.7230
 2005-Sep-22 05:53 *m  291.2007  31.2405 1.4006742E+07   4.30539  0.7227
 2005-Sep-22 05:54 *m  291.3510  31.0847 1.4007000E+07   4.30557  0.7224
 2005-Sep-22 05:55 *m  291.5013  30.9291 1.4007259E+07   4.30574  0.7222
$$EOE
$$SOE
 2005-Sep-22 07:15 *m  303.6360  19.0892 1.4027933E+07   4.30398  0.7248
 2005-Sep-22 07:16 *m  303.7910  18.9500 1.4028191E+07   4.30376  0.7251
 2005-Sep-22 07:17 *m  303.9462  18.8112 1.4028450E+07   4.30354  0.7254
 2005-Sep-22 07:18 *m  304.1014  18.6726 1.4028708E+07   4.30332  0.7257
 2005-Sep-22 07:19 *m  304.2568  18.5343 1.4028966E+07   4.30309  0.7261
 2005-Sep-22 07:20 *m  304.4123  18.3962 1.4029224E+07   4.30286  0.7264
 2005-Sep-22 07:21 *m  304.5680  18.2583 1.4029482E+07   4.30262  0.7267
 2005-Sep-22 07:22 *m  304.7237  18.1208 1.4029740E+07   4.30238  0.7271
 2005-Sep-22 07:23 *m  304.8796  17.9834 1.4029999E+07   4.30213  0.7275
 2005-Sep-22 07:24 *m  305.0357  17.8464 1.4030257E+07   4.30188  0.7278
 2005-Sep-22 07:25 *m  305.1918  17.7096 1.4030515E+07   4.30162  0.7282
 2005-Sep-22 07:26 *m  305.3481  17.5731 1.4030773E+07   4.30136  0.7286
 2005-Sep-22 07:27 *m  305.5046  17.4368 1.4031031E+07   4.30110  0.7290
 2005-Sep-22 07:28 *m  305.6611  17.3008 1.4031289E+07   4.30083  0.7294
 2005-Sep-22 07:29 *m  305.8178  17.1650 1.4031547E+07   4.30055  0.7298
 2005-Sep-22 07:30 *m  305.9747  17.0296 1.4031805E+07   4.30027  0.7302
 2005-Sep-22 07:31 *m  306.1317  16.8944 1.4032063E+07   4.29999  0.7306
 2005-Sep-22 07:32 *m  306.2888  16.7594 1.4032321E+07   4.29970  0.7310
$$EOE
Since the exact recording times havn't been registered, only the end of recording is known by the time of storing the file, by the minute only. Therefore some approximations have to be done.
The interval 05:46-05:54 (480 sec) shows a calculated drift of -2.3 Hz. Interpolation for the first recording period of 462 seconds yields -2.2 Hz.
The interval 05:16-07:32 (960 sec) shows a calculated drift of +5.9 Hz. Extrapolation for the second recording period of 989 seconds yields +6.1 Hz.
Difference of frequencies at the begin of the two recording periods is 0.4 Hz.
05:45:20-05:53:02  0.7249-0.7227  -2.2 Hz
07:15:20-07:31:49  0.7249-0.7309  +6.0 Hz
 Date__(UT)__HR:MN         delta  signal
********************************  delay
                                  (sec)
 2005-Sep-22 05:45 1.4004676E+07  46.71
 2005-Sep-22 05:55 1.4007259E+07  46.72
 2005-Sep-22 07:15 1.4027933E+07  46.79
 2005-Sep-22 07:32 1.4032321E+07  46.81
  MRO output: 10 W, 0 dBi -> +40 dBm
  path loss (437.1 MHz, 14 10⁶ km): -228.2 dB
  antenna gain: +17 dBdC
  estimated signal strength: -171 dBm
  overall receiver noise figure (optimistic ?): 3 dB
  equivalent noise bandwidth: 0.5 Hz


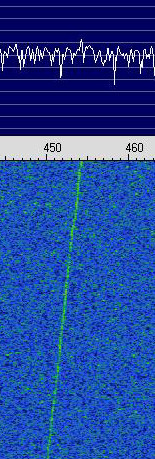
The signal shows up with transform size 8192 and higher (default is 2048).

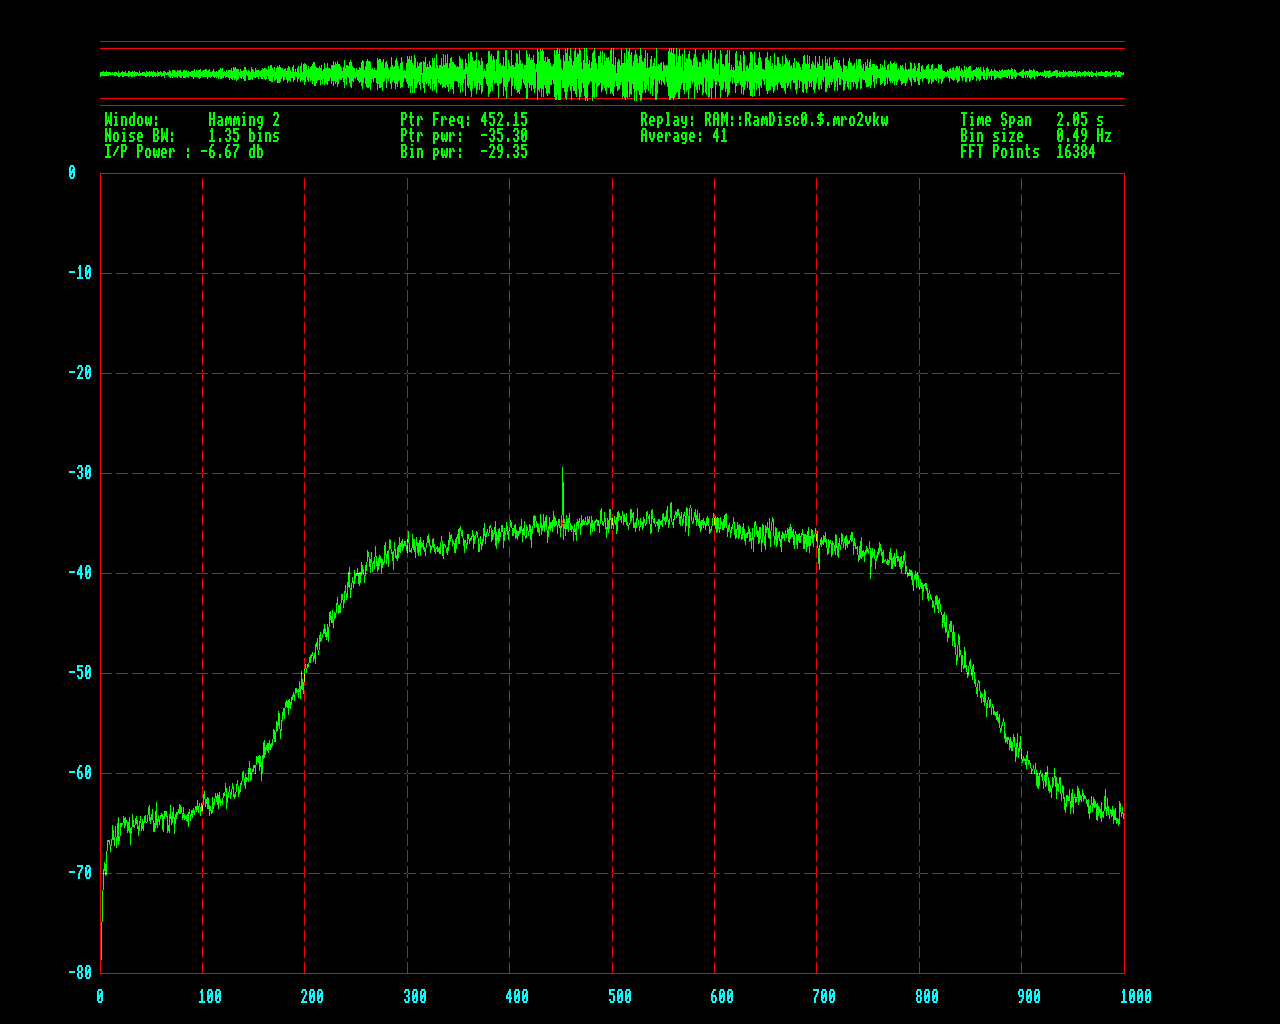
 Second quote:
              (S+N)/N =  -29.36 - (-35.30) dB
                      =   5.95             dB
So the signal-to-noise ratio is
                  S/N =  10^(5.95/10) - 1
                      =  2.94:1
Now, the bin noise bandwidth is 1.35*0.49 = 0.66 Hz
So the carrier-to-noise ratio is:
                  CNR = 2.94*0.66  Hz
                      = 1.94:1     Hz
                      = 2.9        dB-Hz
The file in general, however averages around 2 dB-Hz.

Updated: 2005-10-04